1
2
3
4
5
6
7
8
9
10
11
12
13
14
15
16
17
18
19
20
21
22
23
24
25
26
27
28
29
30
31
32
33
34
35
36
37
38
39
40
41
42
43
44
45
46
47
48
49
50
51
52
53
54
55
56
57
58
59
60
61
62
63
64
65
66
67
68
69
70
| import numpy as np
import matplotlib.pyplot as plt
figsize = 11,9
figure, ax = plt.subplots(figsize=figsize)
index = np.arange(4)
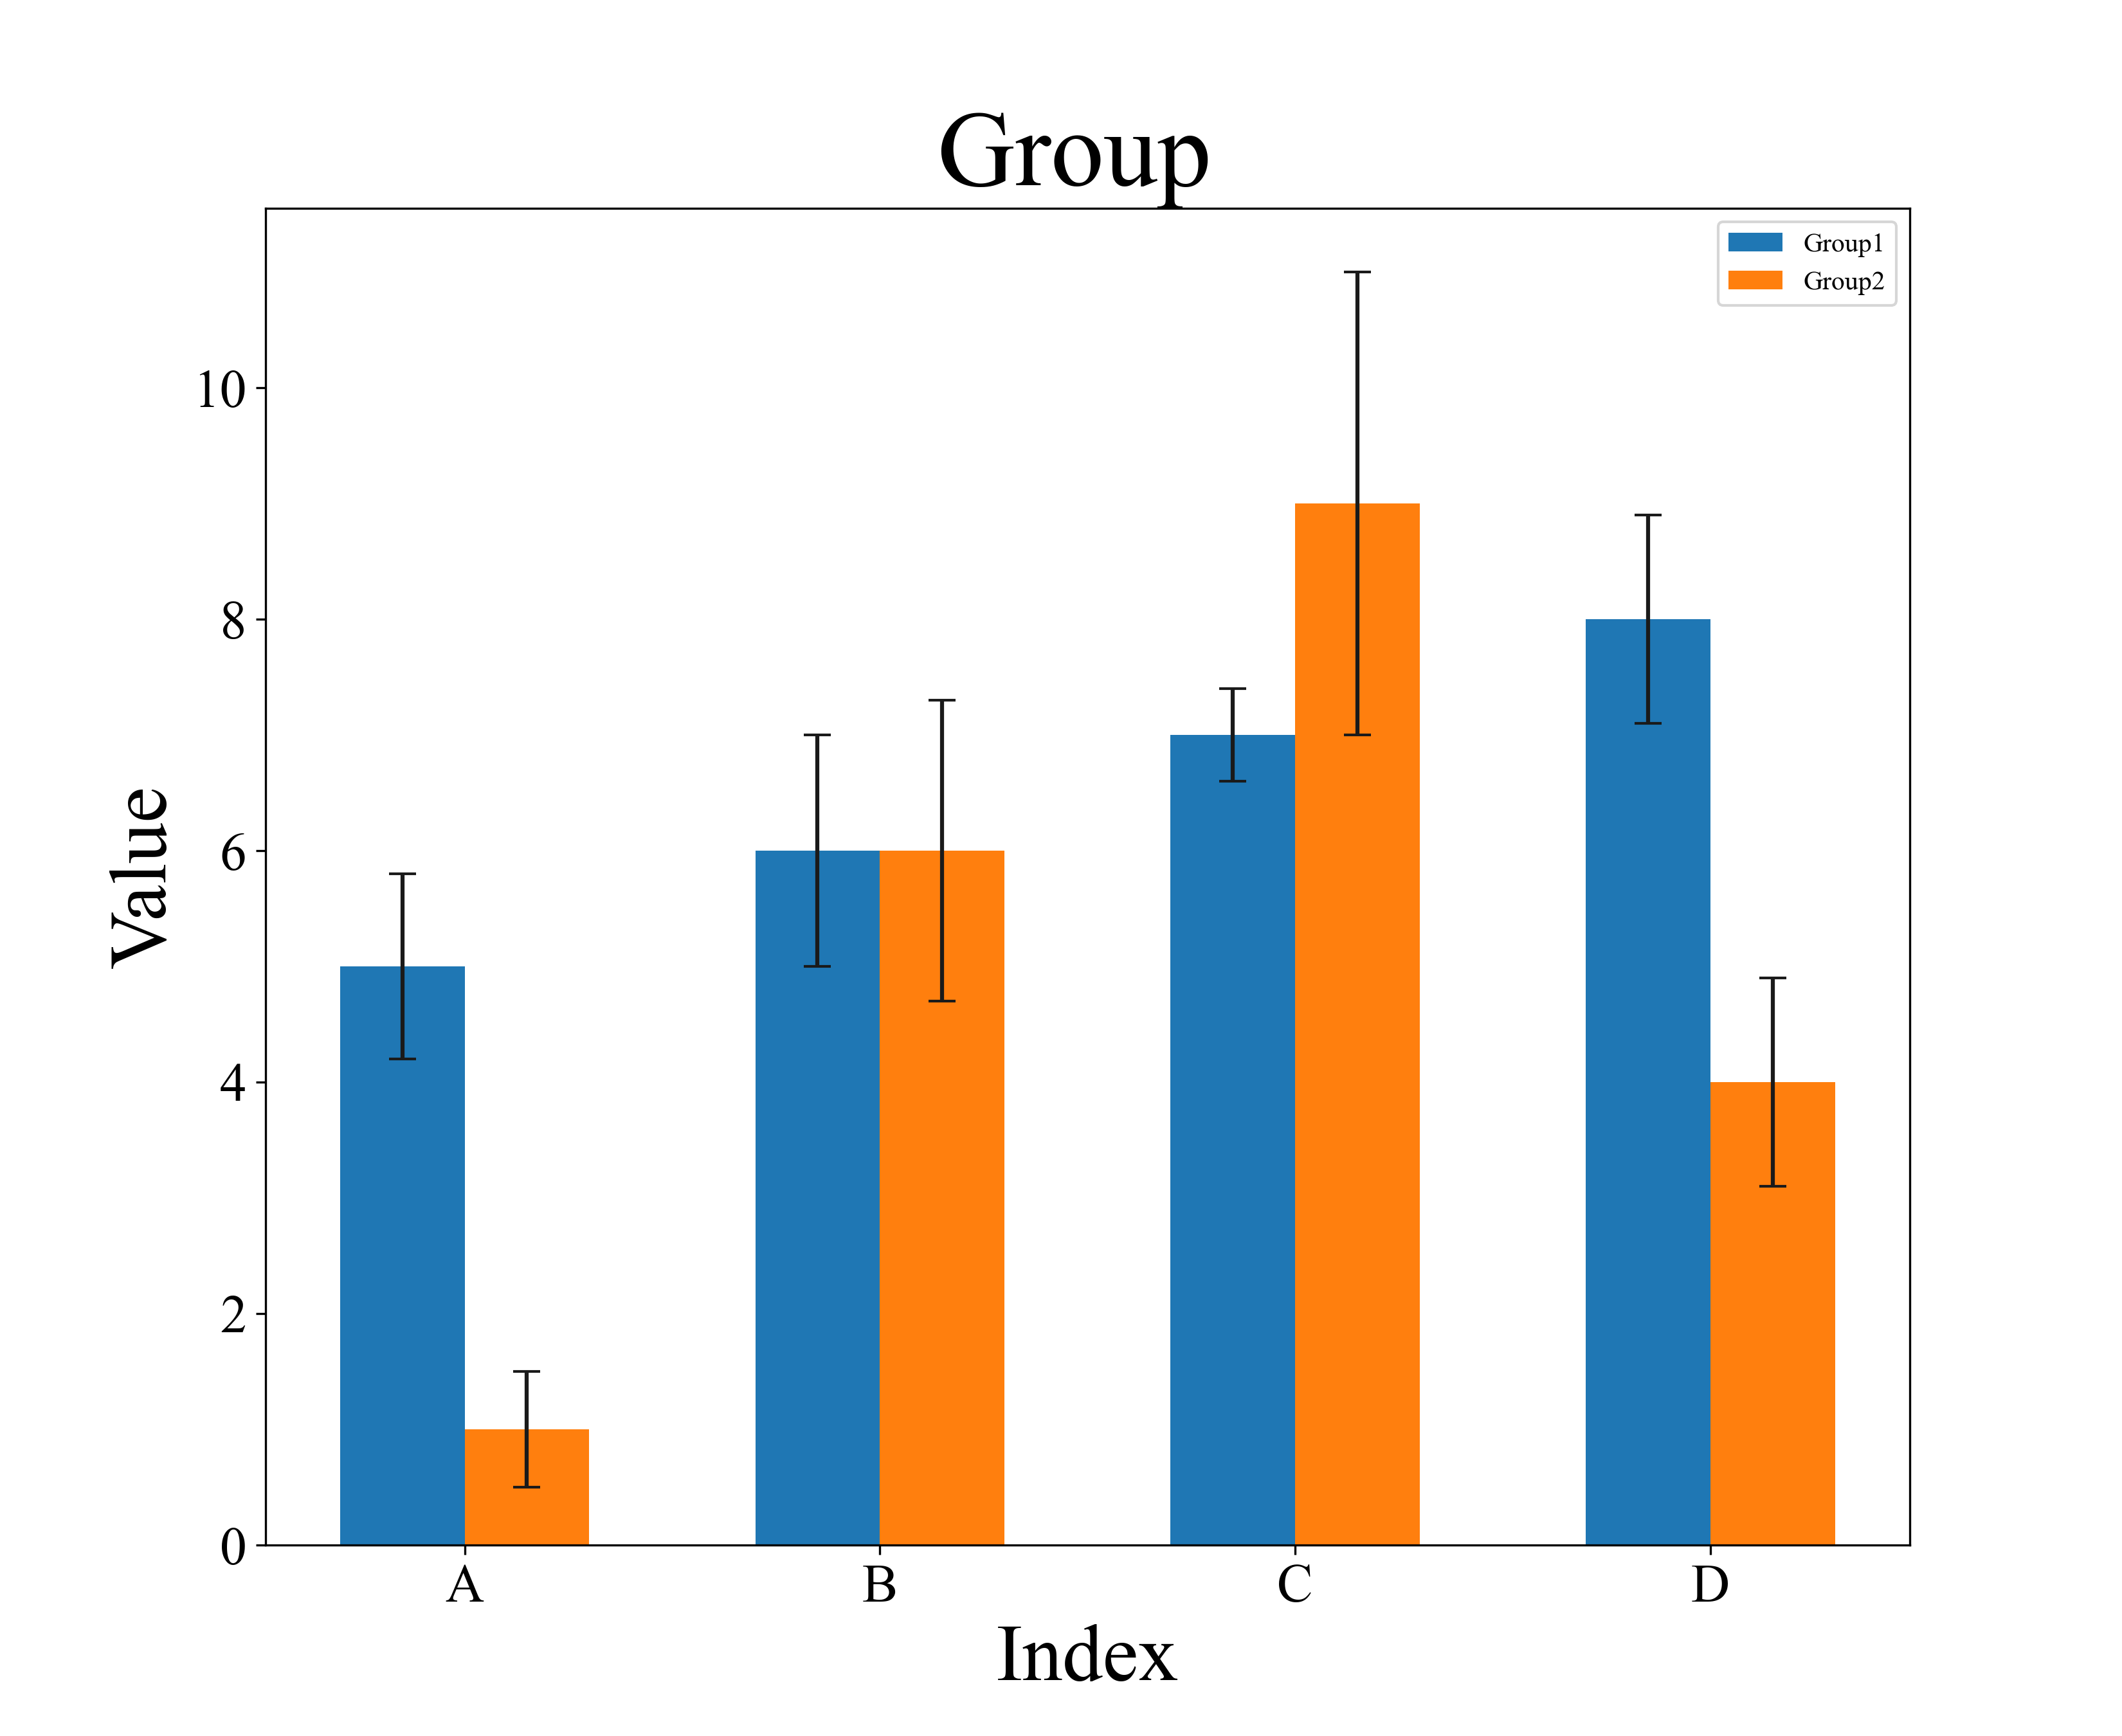
values = [5,6,7,8]
std = [0.8,1,0.4,0.9]
values1 = [1,6,9,4]
std1 = [0.5,1.3,2,0.9]
bw = 0.3
font1 = {
'family' : 'Times New Roman',
'weight' : 'normal',
'size' : 10,
}
plt.title('Group ', fontproperties='Times New Roman', fontsize='40')
plt.tick_params(labelsize=20)
labels = ax.get_xticklabels() + ax.get_yticklabels()
[label.set_fontname('Times New Roman') for label in labels]
plt.bar(index,
values,
width=bw,
yerr=std,
error_kw={'ecolor':'0.1',
'capsize':5
},
alpha=1,
label='Group1'
)
plt.xticks(index+0.15, ['A','B','C','D'])
plt.bar(index+bw,
values1,
width=bw,
yerr=std1,
error_kw={'ecolor':'0.1',
'capsize':5
},
alpha=1,
label='Group2'
)
plt.xticks(index+0.15, ['A','B','C','D'])
plt.ylabel('Value', font1, fontsize='30')
plt.xlabel('Index', font1, fontsize='30')
plt.legend(loc=1, prop=font1)
plt.savefig('D:/UserData/Desktop/Figure1.png', dpi=300)
plt.show()
|


